
Real Yield vs. Nominal Treasury Spreads: How Inflation Expectations Drive Equity Multiples and Bond Duration Risk
A macroeconomic framework explaining the Fisher Equation, TIPS breakeven inflation spreads, why rising real Treasury yields compress growth equity P/E multiples, and how duration risk governs fixed-income portfolios.

What Is the Difference Between Real Yield and Nominal Treasury Yield?
Nominal Treasury yield is the stated coupon return on government debt before inflation, whereas real yield is the purchasing-power return earned after subtracting expected inflation (measured directly via TIPS). When real yields rise sharply, they raise the risk-free discount rate, compressing high-multiple equity valuations and inflicting capital losses on long-duration bonds.
The Mispricing Trap: Watching Nominal Yields While Missing Real Rates
Retail investors and financial commentators obsess over the headline 10-Year U.S. Treasury nominal yield. Yet a 4.50% nominal yield tells you almost nothing about financial conditions in isolation. If expected inflation stands at 4.00%, a 4.50% nominal yield delivers a meager +0.50% real return—an accommodative environment where borrowing in real terms is nearly free. Conversely, if inflation expectations anchor at 2.10% while the 10-Year nominal yield holds at 4.35%, the 10-Year Real Yield jumps to +2.25%, representing restrictive monetary tightening across every risk asset class.
"Nominal interest rates reflect the price of money today; real yields reflect the true hurdle rate of capital after stripping away monetary debasement."
The Fisher Equation & TIPS Breakeven Inflation
Institutional fixed-income desks decompose every nominal sovereign bond yield into two observable components using the Fisher identity and Treasury Inflation-Protected Securities (TIPS):
Nominal Yield (i) ≈ Real Yield (r) + Expected Inflation (π_e)
10Y Breakeven Inflation Rate = 10Y Nominal Treasury Yield - 10Y TIPS Real Yield
When a 10-Year Nominal Treasury trades at 4.35% and the 10-Year TIPS trades at a +2.25% real yield, the bond market is pricing an average 10-year CPI inflation rate of exactly 2.10%. Knowing which component moved—real yield or breakeven inflation—tells portfolio managers whether markets are pricing an overheating inflationary boom or tighter central bank real-rate policy.
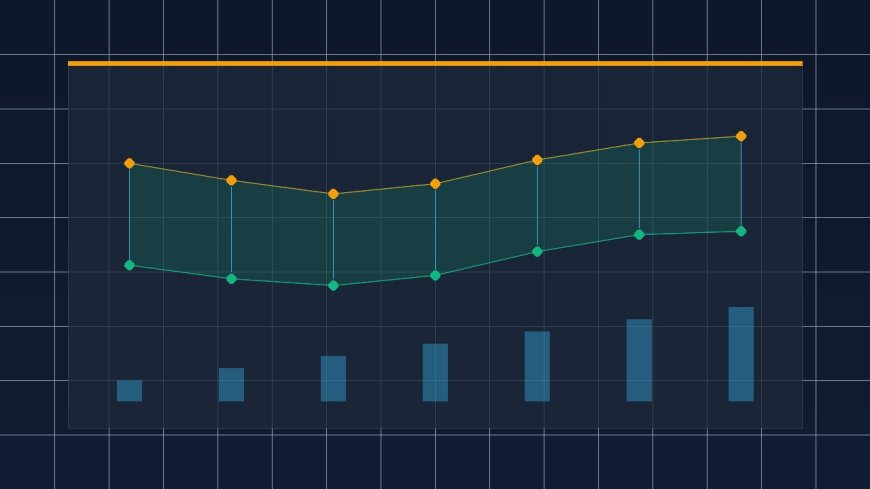
Real Yield & Treasury Spread Benchmark Tracker
Adjust the interactive sliders and parameters below to calculate real-time figures for this scenario:
Why Rising Real Yields Compress Equity P/E Multiples
Every equity valuation model—whether a multi-stage Discounted Cash Flow (DCF) or Gordon Growth Model—discounts future corporate cash flows back to present value using a discount rate anchored by the risk-free real rate plus an Equity Risk Premium (ERP):
Fair Equity Value = Free Cash Flow / (Real_Risk_Free_Rate + Equity_Risk_Premium - Real_Growth_Rate)
Long-duration growth stocks (such as unprofitable AI, biotech, or high-multiple software firms whose cash flows sit 10 to 15 years in the future) exhibit extreme sensitivity to real-rate shifts. When the 10-Year Real Yield climbs by 100 basis points (+1.00%), a company trading at 35x forward earnings can experience a 20% to 28% P/E multiple contraction even if its quarterly earnings per share beat consensus estimates.
Bond Duration Risk & Real-Rate Shock Sensitivity
In fixed income, Modified Duration measures the approximate percentage price change of a bond for every 1.00% (100 bps) shift in yield:
Approximate Bond Price Change (%) = -Modified_Duration * ΔYield
The matrix below illustrates how a sudden +100 bps surge in real yields—similar to episodes triggered by sticky inflation or fiscal deficit supply shocks—impacts distinct asset classes across a 12-month horizon:
| Asset Class / Instrument | Effective Duration (Years) | Baseline Real Yield / Earnings Yield | Price Impact of +100 bps Real Yield Shock | Primary Transmission Mechanism |
|---|---|---|---|---|
| 3-Month U.S. Treasury Bills | 0.25 Years | +2.15% Real | -0.25% (Negligible) | Rapid reinvestment resets higher coupon |
| 5-Year Treasury Notes | 4.50 Years | +1.95% Real | -4.50% Price Drop | Moderate coupon cushion offsets duration |
| 20-Year Long Treasury Bond | 16.80 Years | +2.45% Real | -16.80% Price Drop | Severe convexity & duration drawdown |
| Value / Dividend Equities (14x P/E) | ~11.0 Years | 7.14% Earnings Yield | -10% to -13% | Near-term cash flows buffer discount rate |
| Long-Duration Growth Tech (40x P/E) | ~24.0 Years | 2.50% Earnings Yield | -22% to -28% | Terminal value heavily discounted |
Strategic Portfolio Positioning Across Real-Yield Regimes
Understanding real-yield regimes prevents investors from fighting central bank liquidity cycles:
- Falling Real Yields + Rising Breakevens (Reflation): Favors physical gold bullion, commodities, TIPS, and cyclical equities as real purchasing power erodes.
- Rising Real Yields + Anchored Breakevens (Tightening): Favors short-duration Treasury Bills, floating-rate corporate credit, and cash-generative value equities with low debt-to-EBITDA ratios.
- High Positive Real Yields (>2.0%) + Falling Inflation (Disinflationary Peak): Signals the optimal institutional entry window to lock in 10-to-20-year nominal Treasuries and TIPS before rate cuts compress yields back toward neutral.
Convexity & Term Premium: Why the Long End Moves Differently
While the Federal Reserve directly controls overnight policy rates at the front end of the Treasury curve, 10-year and 30-year yields are governed by two additional forces: Convexity and the Term Premium. Convexity describes the non-linear curvature of bond prices—meaning a 100 bps drop in real yields produces a larger capital gain on a 20-year zero-coupon bond than the capital loss inflicted by a 100 bps rise. Meanwhile, the Term Premium represents the extra yield investors demand for locking up capital across multi-decade fiscal deficits and sovereign supply risk.
When sovereign debt issuance expands faster than foreign central bank and pension demand, the Term Premium widens—pushing 10-year real yields higher even if the central bank pauses overnight rate hikes. Equity investors who ignore Term Premium expansion frequently misread a "Fed pause" as an automatic green light for high-multiple growth stocks, only to suffer valuation compression as long-end real rates grind upward.
Cross-Asset Correlation Flip: When Bonds Stop Hedging Equities
During low-inflation deflationary scares (2009–2020), stocks and Treasury bonds exhibited negative correlation: when equities fell, bond yields plunged and bond prices rallied to cushion portfolios. In supply-shock or sticky-inflation regimes above 3% CPI, that correlation flips positive—rising inflation pushes real yields up, hurting both equities and long-duration bonds simultaneously.
5-Point Institutional Yield & Duration Checklist
- Track 10-Year TIPS Daily, Not Just Nominal Yields: Monitor whether rate moves are driven by inflation expectations (breakevens) or real monetary tightening (TIPS).
- Match Liability Horizons to Bond Duration: Never hold 20-year duration bond funds for capital needed within 36 months; anchor short-term liquidity in T-Bills under 1-year maturity.
- Audit Equity Portfolio "Implied Duration": Calculate the weighted-average P/E and free-cash-flow yield of your equity holdings to avoid unintentional overexposure to 40x+ long-duration multiples.
- Verify Equity Risk Premium Spreads: Compare the S&P 500 earnings yield (
1 / Forward P/E) against the 10-Year Treasury yield; when the spread narrows below 1.0%, risk-free Treasuries compete directly with stocks for institutional capital. - Use Treasury Ladders to Neutralize Reinvestment Risk: Stagger maturities across 3-month, 1-year, 3-year, and 5-year rungs so yield spikes become reinvestment opportunities rather than permanent mark-to-market losses.



















Comments