
Yield Curve Inversions and Recession Forecasting: Understanding the 10-Year vs. 2-Year Treasury Spread
An institutional analysis of yield curve inversions and their historical accuracy as macroeconomic recession indicators. Understand the mechanics of the 10Y-2Y Treasury spread, term premiums, and portfolio defense strategies.
 Dr. Arthur Pendelton
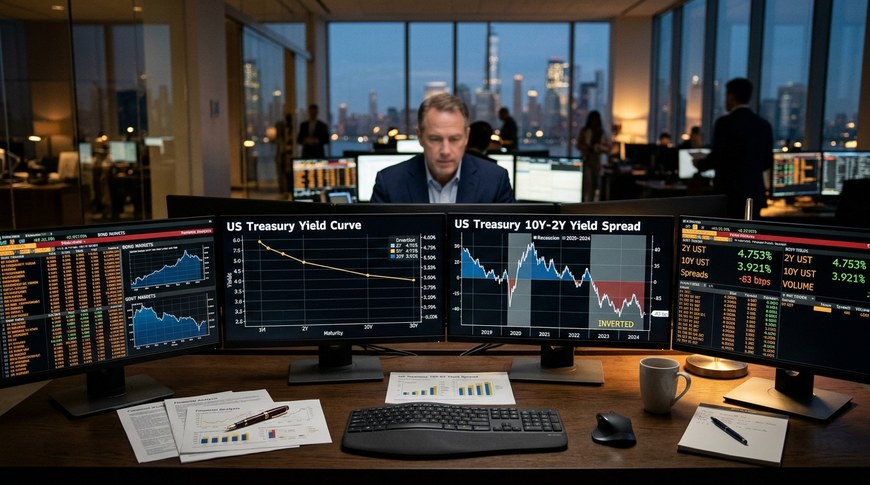
Across the entire spectrum of financial market indicators, macroeconomic surveys, and econometric models, few signals carry the historical gravity and predictive pedigree of an inverted sovereign yield curve. Since 1955, an inversion of the United States Treasury yield curve—most notably measured by the spread between the 10-Year Treasury Constant Maturity rate and the 2-Year Treasury note—has preceded every single domestic recession, delivering only one false positive signal over nearly seven decades of financial history. Understanding the economic forces that invert the yield curve is essential for institutional risk managers, corporate treasurers, and individual investors alike.
In this technical macroeconomic analysis, we examine the structural mechanics of fixed-income term structures, explore why short-term yields eclipse long-term yields during central bank tightening cycles, and evaluate asset class performance dynamics during the critical "un-inversion" transition phase.
1. The Mechanics of the Term Structure of Interest Rates
Under standard macroeconomic conditions, sovereign yield curves exhibit an upward-sloping curvature. Investors demanding longer maturities naturally require higher annualized yields to compensate for two foundational risks:
- Duration and Interest Rate Risk: Longer-dated bonds experience substantially greater price volatility when benchmark discount rates fluctuate.
- Inflation Uncertainty & Term Premium: The longer the maturity horizon, the greater the uncertainty regarding future purchasing power erosion, necessitating an embedded yield premium known as the term premium.
| Yield Curve State | 10Y − 2Y Spread Range | Macroeconomic Implication | Typical Business Cycle Phase |
|---|---|---|---|
| Steepening Curve | +150 to +300 bps | Accelerating economic activity, rising inflation expectations, low front-end policy rates | Early-Cycle Recovery |
| Normal / Flattening | +50 to +140 bps | Stable mature expansion; central bank calibrating neutral monetary policy | Mid-Cycle Expansion |
| Inverted Curve | −10 to −110 bps | Restrictive monetary policy; institutional bond markets pricing future economic contraction | Late-Cycle / Pre-Recession |
| Bear / Bull Steepening (Un-inversion) | Crossing from negative back to positive | Impending monetary easing or acute recession onset; historically the highest-risk phase | Cycle Turning Point |
2. Why Does the Curve Invert? The Collision of Monetary Policy and Market Expectations
A yield curve inversion occurs when the front end (short-term maturities such as the 3-month bill and 2-year note) is anchored by the Federal Reserve's restrictive policy rate, while the back end (10-year and 30-year bonds) is suppressed by institutional expectations of slowing growth, falling terminal inflation, and future rate cuts.
When the Federal Reserve aggressively raises the benchmark Federal Funds Rate to combat cyclical inflation, short-term debt instruments immediately reprice higher to reflect elevated interbank lending costs. However, institutional bond investors recognize that prolonged policy restriction will eventually dampen credit creation, corporate capital expenditures, and consumer demand.
Anticipating an eventual economic deceleration, large institutional pension funds, sovereign wealth managers, and asset managers lock in longer-term yields by buying 10-year Treasuries. This massive capital influx drives 10-year bond prices upward and pushes their yields downward until they drop beneath 2-year paper, generating the negative spread (inversion).
Track Benchmark Yields & Borrowing Costs
Monitor real-time borrowing cost impacts across commercial mortgages and consumer debt using the RichQuill Interest Rate Tracker & Loan Comparison Suite →.
3. The Un-Inversion Trap: When Does the Recession Actually Arrive?
A frequent error among retail market participants is expecting an economic downturn to materialize on the day the yield curve first flips negative. Historically, the temporal lag between initial inversion and the official onset of a National Bureau of Economic Research (NBER) designated recession averages between 12 and 18 months.
Equally critical is recognizing that the acute period of equity market vulnerability and labor market contraction historically occurs not during the depth of the inversion, but during the un-inversion—when the spread crosses back from negative territory into positive territory:
- The Bull Steepener Catalyst: As economic growth deteriorates and unemployment metrics tick higher, the central bank initiates emergency rate cuts. The front-end 2-year yield plunges rapidly while 10-year yields hold steady, snapping the curve back into positive territory.
- Historical Equity Performance: Equities frequently reach cyclical peaks late in the inversion period. The subsequent un-inversion often coincides with corporate earnings downgrades, widening credit default swap (CDS) spreads, and heightened equity volatility.
4. Strategic Asset Allocation Across Yield Curve Transitions
Institutional portfolio managers calibrate exposures dynamically as the term structure transitions across cycle phases:
- Duration Extension in Sovereign Debt: In deep inversion regimes, locking in peak yields across intermediate high-quality Treasuries (5–7 year maturities) provides substantial capital appreciation potential when benchmark rates eventually pivot downward.
- Credit Spread Scrutiny: Inverted curves tighten commercial bank lending standards. High-yield corporate credit ("junk bonds") become vulnerable to refinancing cliffs as low-coupon pandemic-era debt matures into elevated market rates. Prioritizing investment-grade balance sheets with low net-debt-to-EBITDA ratios is paramount.
- Quality and Cash Flow Defensive Positioning: In equity holdings, defensive sectors with robust free-cash-flow yields, unencumbered pricing power, and essential consumer demand (healthcare, essential infrastructure, defense) historically outperform cyclical cyclicals with high capital expenditure burdens.
Frequently Asked Questions (FAQ)
Which yield curve spread is more reliable: 10Y–2Y or 10Y–3M?
Both metrics boast formidable historical track records. The 10Y–3M spread is preferred by academic researchers and the Federal Reserve's econometric models because the 3-month Treasury bill directly tracks the current policy rate without speculative pricing. The 10Y–2Y spread is preferred by bond traders because it reflects the market's forward expectations over the standard policy horizon.
Can an inverted yield curve be a "false alarm"?
While economic models can never guarantee future outcomes with mathematical certainty, the 10Y-2Y yield curve has inverted prior to every US recession since the mid-1950s, producing only one notable false signal in the mid-1960s (which was followed by a sharp industrial growth slowdown). Treating an inversion as a serious signal of late-cycle macro risks remains standard institutional practice.












Comments