
LTV:CAC Ratio & Payback Period Distortion: Auditing SaaS and Subscription Unit Economics for True Capital Efficiency
A forensic guide to auditing inflated SaaS and subscription LTV:CAC ratios, adjusting lifetime value for gross margin and logo churn, and calculating true cash-adjusted CAC payback periods.

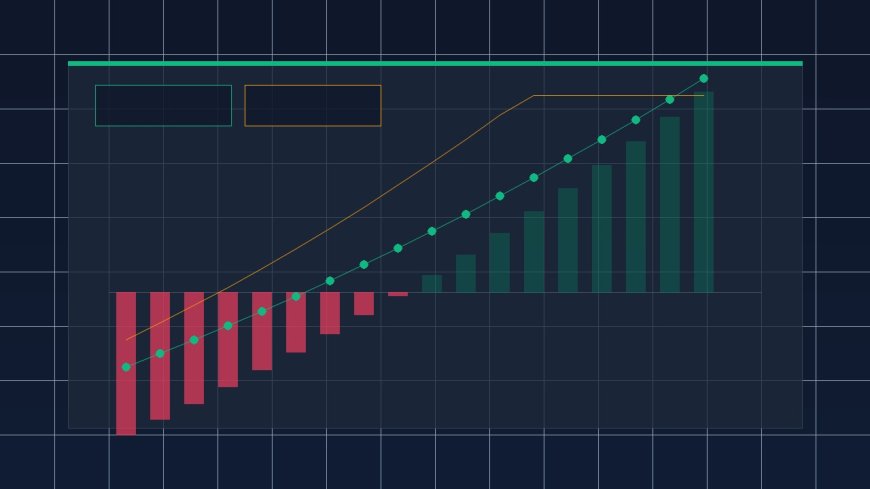
Why Do Reported LTV:CAC Ratios Overstate True Capital Efficiency?
Most early-stage companies overstate their LTV:CAC ratio by 35% to 60% because they compute Lifetime Value using top-line revenue instead of gross-margin dollars, ignore customer support and hosting costs, and divide by artificially low monthly churn rates that fail to reflect cohort decay or cash payback timing.
The Anatomy of Vanity Unit Economics
In venture-backed SaaS, e-commerce subscriptions, and B2B managed services, the 3:1 LTV:CAC benchmark is widely treated as the gold standard of scalable growth. Yet hundreds of companies reporting "4.5:1 LTV:CAC" in investor decks still run out of cash while scaling customer acquisition. The discrepancy rarely stems from fraud; it stems from three systemic accounting distortions embedded in naive LTV formulas.
First, teams calculate LTV on Average Revenue Per Account (ARPA) rather than Gross Margin. A subscription business with a 65% gross margin cannot spend 100% of gross revenue to repay acquisition costs. Second, marketing teams omit fully loaded Customer Acquisition Cost (CAC)—excluding SDR salaries, sales commissions, onboarding labor, and failed trial infrastructure. Third, a 3:1 LTV:CAC ratio says nothing about when cash returns to the bank account. If LTV takes 48 months to materialize while CAC is paid upfront on Day 1, rapid growth creates an immediate working capital crisis.
"LTV:CAC measures theoretical unit profitability over an idealized horizon; CAC Payback Period measures whether your balance sheet can survive long enough to collect it."
The Institutional Gross-Margin LTV & Payback Formulas
To eliminate revenue inflation, institutional CFOs enforce strict gross-margin and cohort-adjusted equations:
Gross-Margin LTV = (ARPA_monthly * Gross_Margin_%) / Monthly_Logo_Churn_%
Fully Loaded CAC = (Total_Sales_&_Marketing_Spend + Onboarding_Labor) / New_Paying_Customers
CAC Payback Period (Months) = Fully_Loaded_CAC / (ARPA_monthly * Gross_Margin_%)
Suppose a B2B software firm charges $342 per month (ARPA), carries $120 per month in direct COGS (cloud compute, third-party APIs, and dedicated support), yielding a $222 monthly gross profit (64.9% gross margin). If monthly logo churn is 3.0%, its true Gross-Margin LTV is $222 / 0.03 = $7,400. By contrast, a naive top-line formula using $342 revenue would report $342 / 0.03 = $11,400—an immediate 54% overstatement of customer value.
Gross Margin & Contribution Payback Simulator
Adjust the interactive sliders and parameters below to calculate real-time figures for this scenario:
Time-Value Decay & The "Infinite Horizon" Fallacy
Even gross-margin-adjusted LTV hides a mathematical flaw when churn is very low. If monthly churn is 1.0%, the formula 1 / 0.01 assumes an average customer lifespan of 100 months (8.3 years). In reality, software architectures obsoleted in four years, M&A consolidation, and competitive pricing pressure cap practical economic lifespans. Institutional analysts apply a Discounted LTV using the firm's Weighted Average Cost of Capital (WACC) or a hard 36-to-60-month cap:
Capped LTV (36M) = Sum over 36 Months [ (ARPA * GM%) * Retention_Rate(t) / (1 + WACC_monthly)^t ]
Side-by-Side Audit: Naive Pitch Deck Metrics vs. CFO Reality
The table below demonstrates how a typical Series A B2B subscription company's unit economics transform when subjected to a forensic CFO audit across the exact same customer cohort:
| Metric Component | Naive Marketing Calculation | Forensic CFO Audit | Distortion / Variance |
|---|---|---|---|
| Monthly ARPA | $342.00 | $342.00 | 0% (Baseline) |
| Direct COGS & Support | Excluded ($0) | $120.00 / month | 35.1% Margin Drag |
| Monthly Gross Profit | $342.00 (100% assumed) | $222.00 (64.9% GM) | -$120.00 / month |
| Monthly Logo Churn | 2.0% (Blended w/ Legacy) | 3.2% (Recent Cohort) | +120 bps Churn Risk |
| Calculated LTV | $17,100 (50-mo life) | $6,938 (31.25-mo life) | -59.4% LTV Collapse |
| Customer Acquisition Cost | $2,800 (Ad Spend Only) | $3,996 (Fully Loaded) | +42.7% Higher CAC |
| Reported LTV:CAC Ratio | 6.11 : 1 (Elite) | 1.74 : 1 (Sub-Scale) | Below 3:1 Hurdle |
| CAC Payback Period | 8.2 Months | 18.0 Months | +9.8 Months Cash Lockup |
This forensic audit explains why a company believing it has a 6.11:1 ratio is actually burning cash dangerously: at a 1.74:1 true ratio and an 18-month payback period, every dollar invested in sales and marketing remains trapped for a year and a half before generating a single dollar of net contribution.
Capital Efficiency Benchmarks: The Rule of 40 & Burn Multiple
When interest rates sit above 4%, institutional investors evaluate growth efficiency through two companion ratios alongside Gross-Margin CAC Payback:
- CAC Payback Ceiling: Target under 12 months for SMB SaaS, under 15 months for Mid-Market, and under 24 months for sticky Enterprise contracts with multi-year upfront billing.
- Net Dollar Retention (NDR): Expansion revenue from upsells and seat growth must exceed churned ARR so that existing cohorts compound at 105% to 120%+ annually—turning negative logo churn into positive net revenue retention.
- Magic Number: Divide annualized net new ARR added in Quarter
Qby total Sales & Marketing spend in QuarterQ-1. A Magic Number above0.75signals efficient go-to-market repeatability.
Cohort Decay & The Blended Churn Illusion
One of the most dangerous analytical errors in subscription finance is dividing gross margin by a single company-wide blended churn rate. Mature enterprise cohorts signed three years ago often exhibit near-zero churn (0.4% monthly), whereas newly acquired self-serve cohorts from paid social or search channels frequently churn at 4.5% to 6.0% monthly during their first 90 days. Blending those two populations produces an artificial 2.0% average that masks severe unit-economic destruction in new-customer acquisition.
Institutional operators solve this through Cohort-Level Survival Curves. Instead of assuming a flat exponential decay forever, finance teams measure cumulative gross profit collected at Month 6, Month 12, and Month 24 for each monthly signup vintage. If a Q1 paid-acquisition cohort only recovers 68% of its fully loaded CAC by Month 12, scaling that channel simply accelerates cash burn regardless of what the legacy blended LTV:CAC ratio suggests.
Working Capital Strain: Why Fast Growth Consumes Cash
Even with a healthy 3.5:1 Gross-Margin LTV:CAC ratio and a 12-month payback period, rapid month-over-month acquisition growth creates a temporary cash trough known as the SaaS Cash Flow J-Curve. Because 100% of CAC is paid upfront while gross profit trickles in at 1/12th per month, doubling monthly marketing spend forces the company to finance multiple overlapping payback cycles simultaneously before earlier cohorts turn cash-flow positive.
5-Step Unit Economics Audit for Growth Teams
- Separate New-Logo CAC from Expansion Spend: Do not dilute new-customer acquisition costs by dividing total marketing spend across upsells to existing accounts.
- Include Implementation & Onboarding Drag: Any unbilled customer success hours required during the first 60 days of onboarding belong directly in COGS or CAC, never buried in general overhead.
- Segment Churn by Acquisition Channel: Paid search cohorts frequently churn 2x faster than organic or partner-referred cohorts; calculate LTV:CAC separately per channel rather than relying on a blended company average.
- Switch to Annual Upfront Billing Incentives: Offering a 10% to 12% discount for annual upfront cash collection compresses CAC Payback from 18 months to Day 1, turning customer acquisition into a self-funding working capital engine.
- Gate Paid Scaling Behind a 12-Month Payback Wall: Freeze incremental ad spend on any channel whose gross-margin payback exceeds 14 months until onboarding retention or pricing tiers improve.




















Comments