
Silver Pullback vs. Gold Structural Floor: Modeling the Gold-to-Silver Ratio After the 2026 Peak
Quantitative comparison of silver pullbacks vs. 24K gold resilience in late 2026 using the Gold-to-Silver Ratio (GSR), industrial demand floors, and volatility-adjusted sizing.

What Does the Gold-to-Silver Ratio Signal in Late 2026?
The Gold-to-Silver Ratio (GSR) measures how many ounces of silver are required to purchase one ounce of gold. When silver pulls back sharply toward $41–$45/oz while gold holds above $3,700–$4,050/oz, the GSR expands above 85:1—historically signaling either recessionary industrial caution or an asymmetric silver mean-reversion setup.
Throughout 2026, precious metals diverged along their dual macroeconomic drivers. Gold operates primarily as a sovereign monetary reserve supported by central bank accumulation and fiscal deficit hedging, giving it a remarkably resilient structural floor even during hawkish Federal Reserve pauses. Silver, by contrast, derives roughly 55% of annual physical demand from industrial fabrication—solar photovoltaics, high-voltage EV power electronics, and AI data-center conductivity—making it 2.2x more volatile than gold during manufacturing slowdowns.
Bullion allocators compute relative metal cheapness using the standardized Gold-to-Silver Ratio (GSR) formula:
GSR = P_gold_oz / P_silver_oz = (P_gold_tola / P_silver_tola)
For instance, if 24K gold trades at $3,740 per troy ounce (or PKR 387,800 per tola) and 999 fine silver trades at $45.30 per ounce (or PKR 4,720 per tola), the GSR stands at 3740 / 45.30 = 82.56. Over the past 50 years, the GSR has oscillated around a long-term structural mean of 62:1 to 68:1, compressing toward 45:1 during inflationary commodity booms and spiking past 85:1 during liquidity tightening.
Live 999 Fine Silver & Chandi Benchmark Matrix
Adjust the interactive sliders and parameters below to calculate real-time figures for this scenario:
Volatility-Adjusted Sizing: Monetary Anchor vs. Industrial Beta
Investors frequently mistake a high Gold-to-Silver Ratio as a signal to abandon gold entirely in favor of silver. In reality, silver carries dramatically higher annualized realized volatility (28%–36%) and wider physical retail bid-ask spreads than sovereign 24K gold bullion (12%–16% volatility). Allocating capital cleanly requires comparing storage density, VAT/GST friction, and drawdown behavior:
| Portfolio Dimension | 24K Gold Bullion (999.9) | 999 Fine Silver Bullion |
|---|---|---|
| Primary Demand Driver | Central Banks, Sovereign Reserves (~70% Monetary) | Solar PV, Electronics, Grid (~55% Industrial) |
| Annualized Price Volatility | 13% – 16% (Defensive Anchor) | 28% – 36% (High-Beta Commodity) |
| Physical Retail Bid-Ask Spread | 1.5% – 3.0% (Assayed Bars) | 6.0% – 14.0% (Fabrication & Vaulting) |
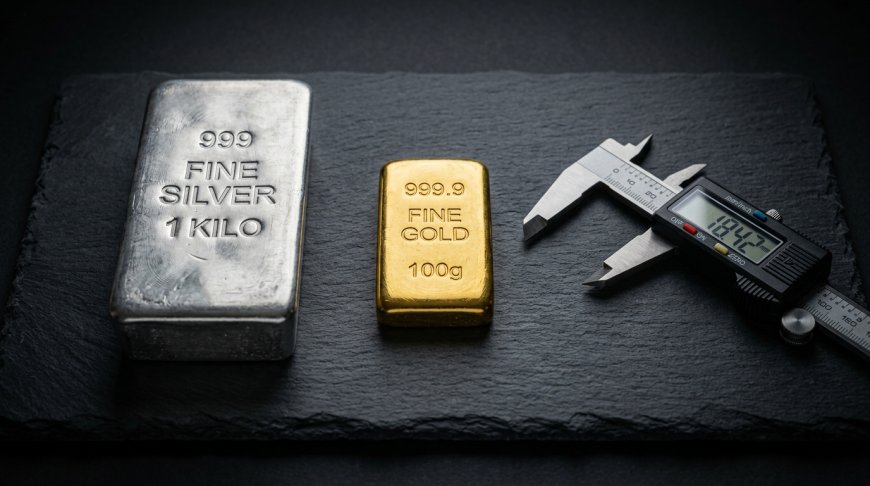
| Value Density ($100,000 Value) | ~0.83 Kilograms (Pocket-Sized) | ~68.5 Kilograms (Heavy Vault Storage) |
| Role in Balanced Treasury | Core Tail-Risk & Currency Hedge (70%–80% of Metals) | Tactical Cyclical Upside Overlay (20%–30% of Metals) |
Executing a Disciplined Ratio Swap Without Retail Friction
Experienced bullion desks never swap physical silver coins for gold bars at retail jewelry counters because dealer markups of 8% to 12% on silver destroy any ratio arbitrage edge. Instead, institutional and private-wealth investors use two friction-minimized execution channels:
- Allocated Bullion Vault Accounts: Platforms holding segregated Zurich, London, or Dubai Good Delivery bars allow direct metal-for-metal swaps at wholesale spreads of 0.50% to 0.85%, capturing GSR compression cleanly when the ratio drops from 85:1 back toward 65:1.
- Core-Satellite Physical Stacking: Maintain 75% of physical metal allocation in high-density 24K assayed gold bars (zero industrial recession drag, tightest local Sarafa/dealer liquidity) and deploy 25% into 1-kilogram cast silver bars strictly during >80:1 ratio dislocations.
"Gold protects balance sheets when central banks lose control of real rates; silver multiplies returns when industrial restocking and monetary easing converge. Respecting their 2.2x volatility spread prevents over-sizing silver during macro drawdowns."
Local Currency Amplification in Emerging Bullion Markets
For buyers in PKR, INR, BDT, or EGP, domestic precious-metal returns compound two distinct variables: international USD spot movement and local FX depreciation. Even during months when USD spot silver corrects 8%, a 3% local currency slide cushions domestic prices, while physical bullion continues to serve as an unencumbered, zero-counterparty store of household savings outside commercial banking risk.
- Track Local Spot vs. International Parity: Compare local Sarafa or bullion quotes against international USD spot multiplied by the interbank FX rate to avoid overpaying during temporary domestic supply squeezes.
- Audit Silver Fineness Before Purchase: Insist on stamped
999or999.9cast bars rather than unverified 900/925 scrap silver ornaments when buying for investment. - Account for Storage Mass: Above $25,000 in silver allocation, physical weight exceeds 17 kilograms; factor safe-deposit or insured vault fees into net real return calculations.




















Comments