
Platinum vs. Palladium vs. Gold Industrial Spreads: Evaluating Catalytic Demand, Supply Deficits, and Portfolio Hedging
A comparative institutional analysis of Platinum, Palladium, and Gold across monetary reserve status, automotive catalytic substitution, South African/Russian supply concentration, and historical price-ratio spreads.

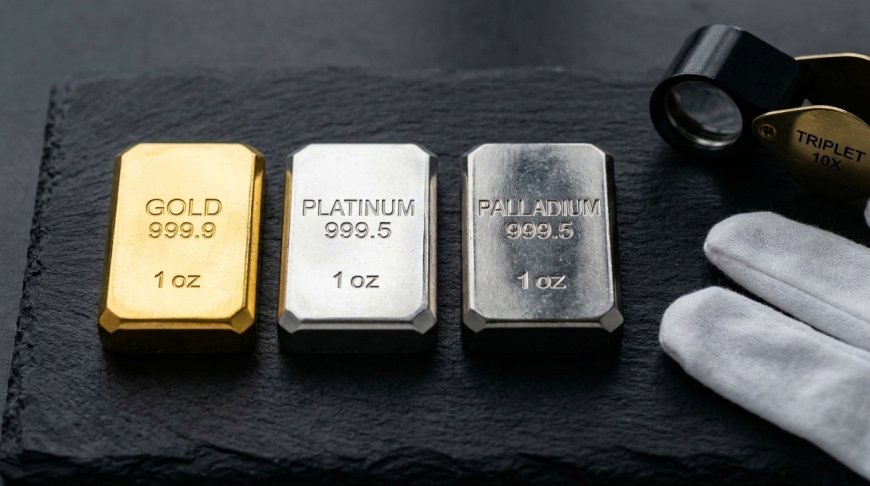
How Do Platinum and Palladium Differ from Gold as Portfolio Assets?
Gold is primarily a monetary reserve and sovereign tail-risk hedge held by central banks, whereas Platinum and Palladium are industrial Platinum Group Metals (PGMs) whose prices depend heavily on automotive catalytic converters, chemical refining, and hydrogen fuel-cell demand—making them far more cyclical than gold.
Monetary Metal vs. Industrial Catalysts
Investors often lump Gold, Silver, Platinum, and Palladium together under "precious metals," assuming they move in lockstep during inflation or geopolitical stress. In practice, their demand drivers diverge sharply. Roughly 85% of annual gold demand stems from jewelry, private investment bars/ETFs, and central bank sovereign reserves. By contrast, over 65% to 80% of Platinum and Palladium demand comes from industrial manufacturing—chiefly exhaust catalytic converters, fiberglass production, electronics, and petrochemical catalysts.
"Gold rises when sovereign debt confidence falls; Platinum and Palladium rise when global industrial output, hybrid vehicle production, and mine supply deficits tighten simultaneously."
Supply Concentration & The Platinum-Palladium Substitution Cycle
Unlike gold—mined across Australia, China, North America, West Africa, and South America—PGM supply is extraordinarily concentrated:
- South Africa produces roughly 70%+ of global primary Platinum supply, exposing output to deep-shaft labor costs and national power-grid disruptions.
- Russia and South Africa together control over 75% of global Palladium supply, creating acute geopolitical and export-sanction sensitivity.
Because Platinum and Palladium share similar chemical properties in emissions abatement, automakers actively substitute between them whenever price spreads widen dramatically. When Palladium surged above $2,500/oz in prior cycles while Platinum lagged near $950/oz, engineers reformulated gasoline catalytic converters to replace expensive Palladium with cheaper Platinum—gradually rebalancing both markets.
Precious Metals Industrial & Bullion Valuation
Adjust the interactive sliders and parameters below to calculate real-time figures for this scenario:
Comparative Matrix: Gold vs. Platinum vs. Palladium
| Metal | Primary Demand Driver | Central Bank Reserve Role | Supply Concentration Risk | Retail Buy/Sell Spread |
|---|---|---|---|---|
| Gold (24K / 999.9) | Monetary Reserve, Jewelry, ETFs | Tier-1 Basel III Asset | Low (Globally Diversified) | Tightest (1% – 3%) |
| Platinum (999.5) | Diesel Catalysts, Hydrogen, Jewelry | None | High (South Africa ~70%+) | Moderate-High (4% – 8%) |
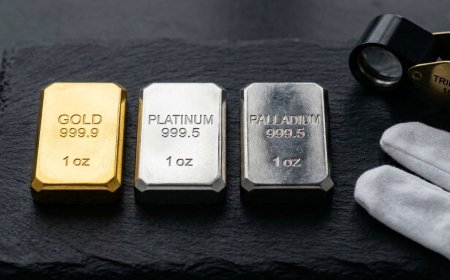
| Palladium (999.5) | Gasoline / Hybrid Catalysts | None | Extreme (Russia + SA ~75%+) | Wide (6% – 12%) |
Measuring the Gold-to-Platinum Ratio & EV Headwinds
Analysts track the Gold-to-Platinum Ratio (Gold Price / Platinum Price) to identify relative value extremes. Historically, Platinum often traded at a premium to Gold (ratio below 1.0) due to greater geological scarcity. Over the past decade, central bank gold accumulation alongside battery-electric vehicle (BEV) adoption expectations pushed the ratio well above 2.0—meaning an ounce of Gold buys more than twice as much Platinum as before.
However, slower pure-EV adoption and stronger hybrid vehicle sales (which still require catalytic converters with higher PGM loadings than pure internal-combustion engines) alongside emerging green-hydrogen electrolyzer demand provide structural support for Platinum whenever mine supply slips into deficit.
Above-Ground Recycling Supply & Lease Rate Signals
Unlike gold—where almost all metal ever mined remains in above-ground vaults and jewelry—a substantial share of annual Platinum and Palladium supply comes from autocatalyst scrap recycling. When used-car scrapping rates slow down during high-interest-rate cycles (because consumers hold older vehicles longer), secondary PGM recycling tightens abruptly, amplifying primary mine deficits.
Institutional commodity desks monitor 1-month and 3-month PGM lease rates as an early physical tightness indicator. When industrial fabricators cannot source physical sponge or ingot for immediate catalytic manufacturing, short-term lease rates spike sharply—often preceding spot price breakouts even before futures open interest reflects the shortage.
For private wealth portfolios, this structural distinction dictates clear role separation: hold 24K Gold and 999 Silver as permanent monetary insurance outside the banking system, and treat Platinum or Palladium strictly as cyclical industrial satellites sized for multi-year supply-deficit cycles.
Green Hydrogen Electrolyzers & Long-Term Substitution Economics
Looking beyond internal-combustion catalytic converters, Platinum plays a strategic role in Proton Exchange Membrane (PEM) hydrogen electrolyzers and heavy-duty fuel-cell commercial trucks. Unlike battery-electric passenger cars, long-haul freight trucks and industrial decarbonization hubs require rapid refueling and high energy density—segments where PEM fuel cells rely directly on Platinum-group catalysts. Even modest multi-gigawatt electrolyzer deployment adds a secular new industrial demand pillar that was virtually nonexistent a decade ago.
Meanwhile, mine-supply economics remain constrained by deep-shaft South African mining inflation, electricity reliability costs, and multi-year capital expenditure cutbacks. Because Platinum is frequently mined as a co-product alongside Palladium, Rhodium, and Nickel, depressed basket prices force marginal shafts offline—creating multi-year supply lags that cannot be reversed quickly when industrial demand rebounds.
5-Point Precious Metals Allocation Checklist
- Anchor Core Crisis Hedges in Gold First: Never substitute Platinum or Palladium for Gold as a banking or recession hedge—industrial metals frequently fall alongside equities during recessions.
- Mind VAT & Sales Tax Rules: In many jurisdictions (including the UK and EU), investment Gold is VAT-exempt while physical Platinum and Palladium bars carry 15%–20% VAT unless held in bonded vaults.
- Account for Dealer Bid-Ask Spreads: Physical Palladium coins and bars carry wide retail spreads; institutional investors often prefer physically backed PGM trusts for tactical exposure.
- Monitor Hybrid vs. Pure-EV Market Share: Rising hybrid adoption directly extends catalytic PGM demand curves compared to pure-BEV forecasts.
- Size Cyclical PGM Positions Conservatively: Cap industrial precious metals at 10%–20% of your total bullion sleeve, keeping 80%+ in liquid 24K Gold and 999 Silver.
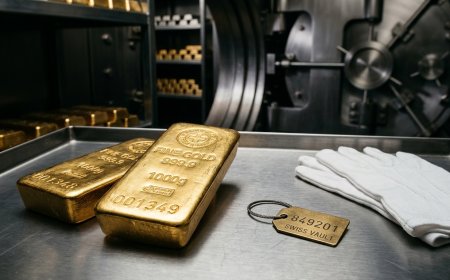
Institutional Storage & Assay Verification: Because Platinum and Palladium trade at different densities and melting points than Gold, always purchase London Platinum and Palladium Market (LPPM) Good Delivery bars or sovereign-minted coins (such as American Platinum Eagles or Canadian Platinum Maple Leafs) with serialized refiner assay certificates. Keeping industrial PGM allocations segregated in non-bank vaults or liquid physically backed trusts avoids retail sales-tax leakage, eliminates counterparty rehypothecation risk during commodity squeezes, and ensures tight institutional exit spreads across international bullion clearing hubs in Zurich, London, and Singapore. Periodically rebalancing PGM profits back into 24K Gold locks in cyclical industrial outperformance while preserving permanent sovereign monetary protection against fiat currency debasement, banking fragility, and multi-year sovereign debt monetization cycles across global reserve currencies. Always confirm independent annual physical bar audits and all-risk bullion insurance before funding any custodial vault account, and verify transparent exit delivery fees for bar withdrawal or assay verification prior to committing institutional capital across multi-year portfolio allocation cycles.















Comments