
Standard Costing and Variance Analysis: A Quantitative Framework for Manufacturing Margin Protection and Cost Control
An executive blueprint for CFOs and operations directors to dissect direct material, labor, and overhead variances, isolate margin leakage, and establish standard cost governance.

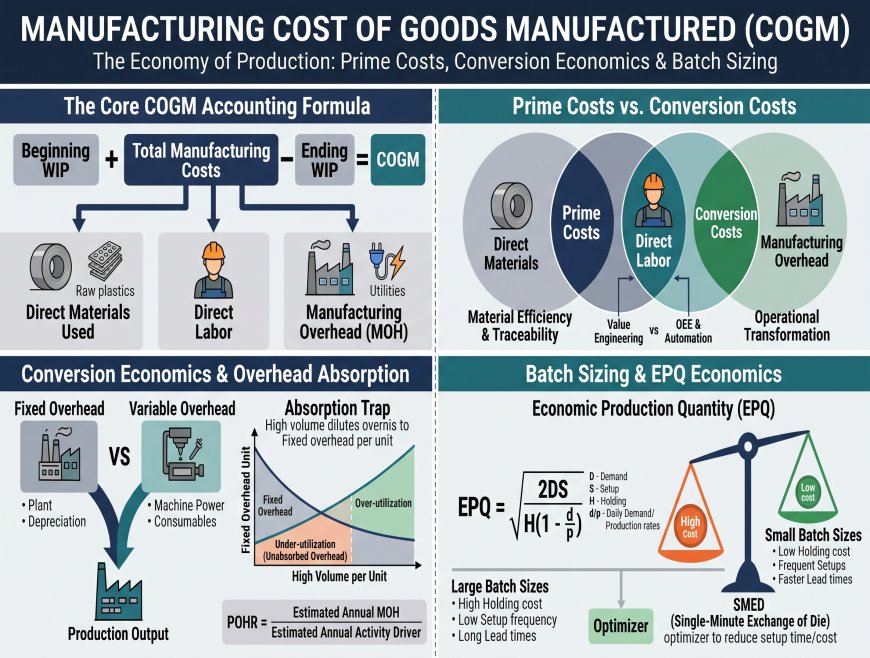
In high-volume manufacturing, advanced hardware assembly, and multi-facility industrial operations, profitability is rarely lost in dramatic, visible corporate catastrophes. Instead, gross margins erode through microscopic, daily operational deviations: an unnoticed five-cent drift in chemical feedstock spot prices, an uncalibrated extrusion machine that consumes 1.8% excess alloy per cycle, or unbudgeted overtime hours deployed to clear end-of-quarter bottlenecks. For industrial CFOs, plant controllers, and operations directors, Standard Costing and Variance Analysis represents the primary cybernetic feedback mechanism for isolating, quantifying, and eliminating these margin leaks before they infect quarterly financial statements.
Without standard costing controls, executive management is forced to rely on historical actual costs—a lagging indicator that obscures shop-floor inefficiencies until months after capital has been wasted. A standard costing architecture converts cost management from a passive recording exercise into an active engineering discipline.
1. The Architecture of Standard Costing
Featured Snippet Answer Capsule: Standard costing establishes predetermined target costs per unit for direct materials, direct labor, and manufacturing overhead. Variance analysis mathematically decomposes the delta between actual results and standard targets into Price (procurement) and Efficiency (operational) components to enforce organizational accountability.
A standard cost is not a casual financial estimate or an unverified historical average; it is a meticulously engineered target cost per unit of finished output. It establishes what a product should cost under specified conditions of operational efficiency, machine uptime, and direct material procurement contracts. A fully burdened standard unit cost integrates three fundamental building blocks:
- Direct Materials (DM): Standard Quantity ($SQ$) multiplied by Standard Price ($SP$).
- Direct Labor (DL): Standard Hours ($SH$) multiplied by Standard Labor Rate ($SR$).
- Manufacturing Overhead (MOH): Split into Variable Manufacturing Overhead (VMOH) allocated on machine or direct labor hours, and Fixed Manufacturing Overhead (FMOH) based on predetermined practical capacity denominators.
When actual financial accounting results are closed at the end of a fiscal cycle, the total manufacturing variance is decomposed into distinct, actionable vectors of operational accountability.
2. Direct Material Variances: Price vs. Quantity Accountability
The total direct material variance represents the net dollar delta between the actual cost incurred for raw inputs and the standard cost allowed for the output achieved. To enforce organizational accountability, this variance is bisected into purchasing performance (Price) and shop-floor engineering efficiency (Quantity):
Direct Material Price Variance (MPV):MPV = AQ × (AP - SP)
Accountability: Chief Procurement Officer / Purchasing Department. Measured at the point of invoice clearance or raw material receipt.
Direct Material Quantity / Usage Variance (MQV):MQV = SP × (AQ - SQ)
Accountability: Plant Operations Manager / Shop Floor Supervisors. Measures physical scrap, yield losses, and material handling defects.
A frequent corporate trap is celebrating an apparently favorable Material Price Variance ($MPV < 0$) without auditing the corresponding Quantity Variance. Purchasing departments incentivized solely on unit price often buy off-spec, lower-grade feedstock from unvetted suppliers. While procurement logs a $60,000 favorable price variance, the defective alloy clogs stamping machinery, spikes scrap rates by 8%, and generates a $115,000 unfavorable Material Quantity Variance, resulting in an unhedged net $55,000 loss.
3. Live Interactive Diagnostic: Run Your Production Variance Audit
Evaluate your production batch variances below. Input your actual units produced, actual versus standard material consumption, and direct labor run times to isolate price and efficiency deltas instantly:
Standard Costing & Variance Diagnostic Engine
Adjust the interactive sliders and parameters below to calculate real-time figures for this scenario:
4. Direct Labor Variances: The Rate and Efficiency Trade-Off
Similar to material variances, total direct labor variances decompose into the rate paid per labor hour versus the productive utilization of that labor:
- Labor Rate Variance (LRV):
LRV = AH × (AR - SR). Reflects differences between contracted wage rates and actual payroll outlays, heavily influenced by shift premiums, emergency overtime rates, and wage grade mix misallocations. - Labor Efficiency Variance (LEV):
LEV = SR × (AH - SH). Quantifies the dollar cost of labor hours consumed beyond engineering standards. Driven by machine downtime, inadequate workforce training, material shortages causing idle time, and suboptimal workstation ergonomics.
5. Comparative Variance Decomposition Matrix
The table below summarizes standard variance taxonomy, departmental ownership, mathematical formulas, and corrective operational remedies across the manufacturing value chain:
| Variance Metric | Mathematical Formula | Primary Ownership | Root Cause & Corrective Action |
|---|---|---|---|
| Material Price (MPV) | AQ × (AP − SP) |
Procurement Desk | Commodity spot surges, loss of volume rebates. Hedge raw contracts or renegotiate terms. |
| Material Usage (MQV) | SP × (AQ − SQ) |
Plant Operations | Tool wear, substandard feedstock, handling scrap. Recalibrate tooling and audit supplier CoA. |
| Labor Rate (LRV) | AH × (AR − SR) |
Production Scheduling | Unplanned overtime, seniority premium staffing on routine lines. Optimize line load scheduling. |
| Labor Efficiency (LEV) | SR × (AH − SH) |
Industrial Engineering | Machine starvation, bottlenecks, inadequate tooling. Rebalance assembly cycle times. |
| Overhead Volume (FPOV) | (Denominator Hrs − SH) × FR |
Executive Management | Idle factory capacity due to macroeconomic demand collapse. Re-evaluate capital asset footprint. |
6. Executive Implementation Roadmap
To institutionalize standard costing and variance governance across corporate manufacturing facilities:
- Enforce Weekly Variance Cadence: Do not wait for monthly general ledger closes to uncover scrap or labor inefficiencies. Run daily shift scrap reports and weekly direct labor efficiency reviews at the shop-floor supervisor level.
- Establish Significance Thresholds: Implement statistical process control (SPC) limits on variance investigations. Focus management intervention exclusively on variances exceeding ±3.5% of standard budget or $5,000 in absolute monetary impact.
- Update Engineering Standards Annually: Standard costs must reflect attainable modern efficiency, not historical relics. Re-benchmark machine cycle times, scrap allowances, and union wage schedules at least once every twelve months to maintain cost accounting integrity.
7. Strategic Executive Summary
Standard costing is the operational compass of modern industrial management. By mathematically isolating price movements from physical process efficiency and holding specific departments accountable, corporate executives defend gross profit margins and compound enterprise value.
5. Fixed Overhead Variances: Spending vs. Volume Mechanics
While variable manufacturing costs vary directly with output volume, fixed manufacturing overhead presents unique accounting challenges. Fixed overhead variances decompose into two distinct components:
- Fixed Overhead Budget / Spending Variance:
Actual Fixed Overhead − Budgeted Fixed Overhead. Reflects differences between actual expenditures on plant rent, supervision, and property taxes versus budgeted allowances. - Fixed Overhead Volume Variance:
Budgeted Fixed Overhead − Applied Fixed Overhead, where applied overhead equals standard hours multiplied by the predetermined fixed overhead rate. A favorable volume variance indicates the plant operated above practical capacity, while an unfavorable variance indicates idle factory capacity.
6. Plant Controller Implementation Checklist
Industrial manufacturing controllers should execute the following monthly review sequence:
- Establish Engineering Bill of Materials Baselines: Ensure standard quantities ($SQ$) are validated by manufacturing process engineers rather than historical procurement averages.
- Enforce Departmental Variance Sign-Offs: Mandate that procurement directors sign off on material price variances ($MPV$), while shop-floor supervisors sign off on material quantity ($MQV$) and labor efficiency ($LEV$) variances.
- Perform Root-Cause Pareto Analysis: Focus engineering resources on the top 20% of SKU variances responsible for 80% of aggregate dollar margin leakage.
7. Frequently Asked Questions
What is the difference between standard costing and actual costing?
Actual costing assigns real historical costs of raw materials, labor, and overhead directly to inventory. Standard costing assigns predetermined engineered target costs to inventory and records the differences in variance accounts on the income statement.
How should standard cost variances be closed out at year-end?
If variances are immaterial, they are closed directly to Cost of Goods Sold (COGS). If variances are material, GAAP mandates that they be prorated across ending Work-in-Process (WIP), Finished Goods, and COGS based on their relative ending balances.




















Comments