
Activity-Based Costing (ABC) Overhead Allocation: Eliminating Product Cross-Subsidization in Multi-Line Enterprises
A strategic managerial accounting framework for enterprise executives to replace arbitrary volume-based overhead allocation with Activity-Based Costing, unmasking hidden product line losses.


In diversified enterprise manufacturing, multi-line consumer brands, and complex B2B services organizations, traditional cost accounting systems frequently generate toxic managerial delusions. Under conventional volume-based absorption costing, indirect manufacturing overhead—comprising plant management, engineering design change orders, machine setups, and quality control inspections—is aggregated into a single massive pool and spread across products based on a simple volume driver, such as direct labor hours or machine run-time.
The catastrophic consequence of this volume-weighted approach is Product Cross-Subsidization: high-volume, standardized, simple product lines are over-costed, while low-volume, highly complex, customized specialty lines are massively under-costed. Management unknowingly celebrates rapid growth in customized product lines that are actively bleeding enterprise value.
1. The Four-Stage Architecture of Activity-Based Costing
Featured Snippet Answer Capsule: Activity-Based Costing (ABC) assigns indirect overhead costs to specific activity pools (setups, inspections, orders) and allocates them to products based on the actual driver transactions each product consumes, eliminating the distortions of volume-based direct labor allocation.
Activity-Based Costing (ABC) fundamentally realigns financial accounting with physical operational realities by recognizing that activities consume resources, and products consume activities. Implementing ABC requires a rigorous four-stage engineering sequence:
- Activity Identification and Resource Tracing: Disaggregate aggregate corporate overhead into discrete operating activity centers (e.g. Machine Tool Setups, Quality Assurance Inspections, Purchase Order Processing, Production Scheduling).
- Cost Pool Assembly: Aggregate all direct and indirect expenses consumed by each activity center into dedicated Cost Pools.
- Cost Driver Selection: Identify the specific physical transaction or metric that causally drives the activity (e.g., number of machine setups, number of engineering change orders, inspection hours).
- Driver Rate Calculation: Compute the predetermined activity rate for each pool:
Activity Rate = Total Cost Pool Expense / Total Driver Capacity.
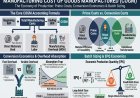
The Core Insight: A product manufactured in a batch of 10,000 units requires ONE machine setup. A custom product manufactured in a batch of 100 units ALSO requires ONE machine setup. Allocating setup costs based on production volume understates the custom product's setup cost by 99%.
2. Mathematical Case Study: The Traditional vs. ABC Paradigm Shift
Consider an enterprise manufacturing two industrial components:
- Product A (Standard Core): 10,000 units annually, requiring 10,000 direct labor hours and 2 machine setups.
- Product B (Customized Specialty): 1,000 units annually, requiring 2,000 direct labor hours and 18 machine setups.
- Total Setup Overhead Pool: $100,000 (20 total setups across the facility).
Under traditional direct labor hour allocation, Product A absorbs $83,333 of setup overhead ($8.33/unit), while Product B absorbs only $16,667 ($16.67/unit). Under Activity-Based Costing, each setup costs $5,000 ($100,000 / 20 setups). Product A incurs $10,000 in setup costs ($1.00/unit), while Product B incurs $90,000 in setup costs ($90.00/unit).
3. Interactive ABC Overhead & Cross-Subsidization Analyzer
Input your multi-product direct costs, volume distributions, and activity drivers into the live engine below to reveal true absorbed unit economics:
ABC Overhead Driver & Cross-Subsidization Model
Adjust the interactive sliders and parameters below to calculate real-time figures for this scenario:
4. Comparative Costing Table: Traditional vs. ABC Economics
| Product Line | Traditional Unit Cost | ABC True Unit Cost | Variance & Managerial Reality |
|---|---|---|---|
| Product A (High-Volume Core) | $58.33 / unit | $51.00 / unit | Over-costed by $7.33. Highly competitive; room to cut price to gain market share. |
| Product B (Low-Volume Custom) | $96.67 / unit | $170.00 / unit | Under-costed by $73.33. Severely loss-making; requires immediate 80% price increase. |
5. Strategic Conclusion and Portfolio Pruning
Activity-Based Costing transforms corporate strategy. By eliminating the distortions of volume-weighted allocation, executive teams make informed capital investments, prune loss-making product variants, and price custom solutions to capture true operational margins.
5. Customer Profitability Analysis and the Stobachoff Curve
Beyond product costing, Activity-Based Costing transforms commercial sales strategy through Customer Profitability Analysis. When enterprise sales overhead (customer service calls, expediting fees, custom packaging, return processing) is traced through activity drivers, companies uncover the Stobachoff Curve:
- Top 20% of Customers: Generate 150% to 200% of total corporate profits (high volume, standardized orders, prompt payment).
- Middle 70% of Customers: Break-even (volume offsets modest custom requirements).
- Bottom 10% of Customers: Destroy 50% to 100% of total enterprise profit (low volume, constant engineering changes, aggressive discounting, endless technical support).
6. Activity-Based Costing Implementation Roadmap
To successfully deploy ABC across multi-line operations:
- Limit Activity Pools to High-Impact Drivers: Avoid creating 50 minor cost pools. Limit your model to 5 to 8 major activity drivers that capture 85% of indirect factory and commercial overhead.
- Interview Departmental Operating Heads: Collect empirical driver capacity data directly from machine operators, quality assurance inspectors, and logistics leads.
- Reprice or Prune Loss-Making SKUs: Use ABC true cost data to mandate price increases on low-volume custom variants or eliminate them from the product catalog entirely.
7. Frequently Asked Questions
Why don't all companies use Activity-Based Costing?
ABC requires substantial initial data collection, complex ERP software integration, and continuous driver tracking, making it resource-intensive to maintain compared to simple volume-based allocation.
Can Activity-Based Costing be used for GAAP external financial reporting?
Generally no. GAAP and IFRS generally require full absorption costing for inventory valuation on external balance sheets. ABC is predominantly an internal managerial accounting tool used for strategic pricing, product design, and operational decision-making.
8. Time-Driven Activity-Based Costing (TDABC)
To eliminate the complex, subjective time surveys required by traditional ABC models, Harvard Business School professors Robert Kaplan and Steven Anderson developed Time-Driven Activity-Based Costing (TDABC):
- Step 1: Calculate Capacity Cost Rate: Determine the cost of supplying practical operational capacity:
Capacity Cost Rate = Total Cost of Capacity / Practical Working Time Available. (e.g., $180,000 engineering overhead / 1,500 available hours = $120.00 per hour). - Step 2: Time Equation Mapping: Estimate the exact minutes required to perform each specific activity transaction (e.g. 15 minutes to process a standard invoice, 45 minutes to process an international invoice with customs paperwork).
- Step 3: Direct Cost Application: Multiply the capacity cost rate by the exact minutes consumed by each transaction. TDABC completely eliminates subjective employee surveys and automatically highlights unused, wasted factory capacity.
9. Enterprise Resource Planning (ERP) Integration for ABC
Sustaining an Activity-Based Costing architecture at scale requires automated integration with modern enterprise ERP platforms (SAP S/4HANA, Oracle NetSuite, or Microsoft Dynamics 365):
- Automated Machine Telemetry: IoT sensors directly record machine tool setup durations, spindle hours, and calibration cycles, feeding actual driver quantities directly into cost accounting sub-ledgers.
- Continuous Profitability Dashboards: Automated dashboards display real-time ABC contribution margins across product lines, customer tiers, and sales channels, alerting controllers when customized SKUs exceed standard overhead allowances.
Automating driver data collection eliminates manual spreadsheet errors and equips executive leadership with real-time gross margin transparency.



















Comments